EA_SMI is based on SMI indicator.
The Stochastic Momentum Index (SMI) is a technical indicator used to assess the momentum and direction of a trend. It is an improved version of the traditional Stochastic Oscillator, designed to provide a more accurate reflection of price changes. Below is an explanation of the basic concepts and usage of the SMI.
Basic Concepts of SMI
- Calculation Method:
- The SMI measures where the current price stands relative to the range of prices over a specific period, considering the highest high and the lowest low.
- First, the median price of the specified period (average of the highest high and the lowest low) is calculated.
- Then, the deviation of the current price from this median is determined and normalized over the range of that period.
- Based on these calculations, two moving averages are used to compute the SMI.
- Formulas:
- Median Price (MP): MP=Highest High+Lowest Low2
- Deviation: Deviation=Current Price−MP
- Moving Average of Deviation (D): D=SMA(Deviation,K)
- Moving Average of Range: Range=SMA(Highest High−Lowest Low,K)
- SMI: SMI=100×DRange
Features of SMI
- Zero Line: The SMI fluctuates between +100 and -100, using the zero line as a reference point to indicate upward (positive values) or downward (negative values) trends.
- Trend Strength: Higher values indicate a stronger trend, while lower values suggest a weaker trend.
- Overbought/Oversold: Generally, values above +40 indicate overbought conditions, and values below -40 indicate oversold conditions, though specific thresholds can be adjusted.
How to Use SMI
- Trend Confirmation:
- When the SMI crosses above the zero line, it indicates the start of an upward trend.
- When the SMI crosses below the zero line, it indicates the start of a downward trend.
- Buy/Sell Signals:
- A downward turn in the SMI from overbought levels can be seen as a sell signal.
- An upward turn in the SMI from oversold levels can be seen as a buy signal.
- Divergence:
- If prices form a new high or low but the SMI does not follow suit, it suggests a potential trend reversal (divergence).
Stoploss is automatically placed based on last swing low/ high (input Barback to scan candlestics)
Takeprofit is made by Risk Ration input parameter.
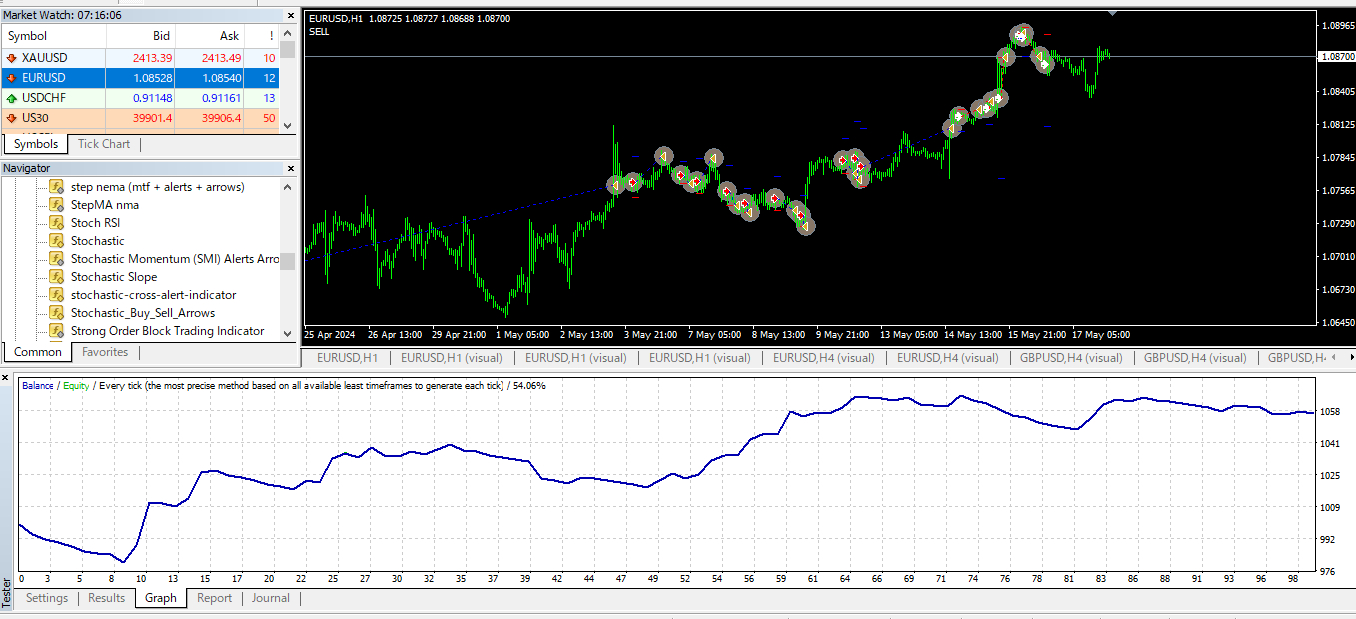
EUH1 (default)







Leave a Reply